How do you make budget modeling, promotions, and performance calibration intuitive
for global teams managing thousands of employees?
As Senior UI/UX Product Designer, I led the design of a powerful SaaS platform built for enterprise HR teams at companies like
Walmart, Monster Energy, and Bacardi. The challenge: translate complex compensation data and planning scenarios into a seamless, visual experience.
From dynamic data visualizations to scenario modeling interfaces, I crafted a system that helps leaders make confident, data-driven decisions—without getting lost in spreadsheets.
This meant designing with scale, compliance, and user empathy at the core—balancing sophistication with simplicity for a high-stakes, high-impact tool.
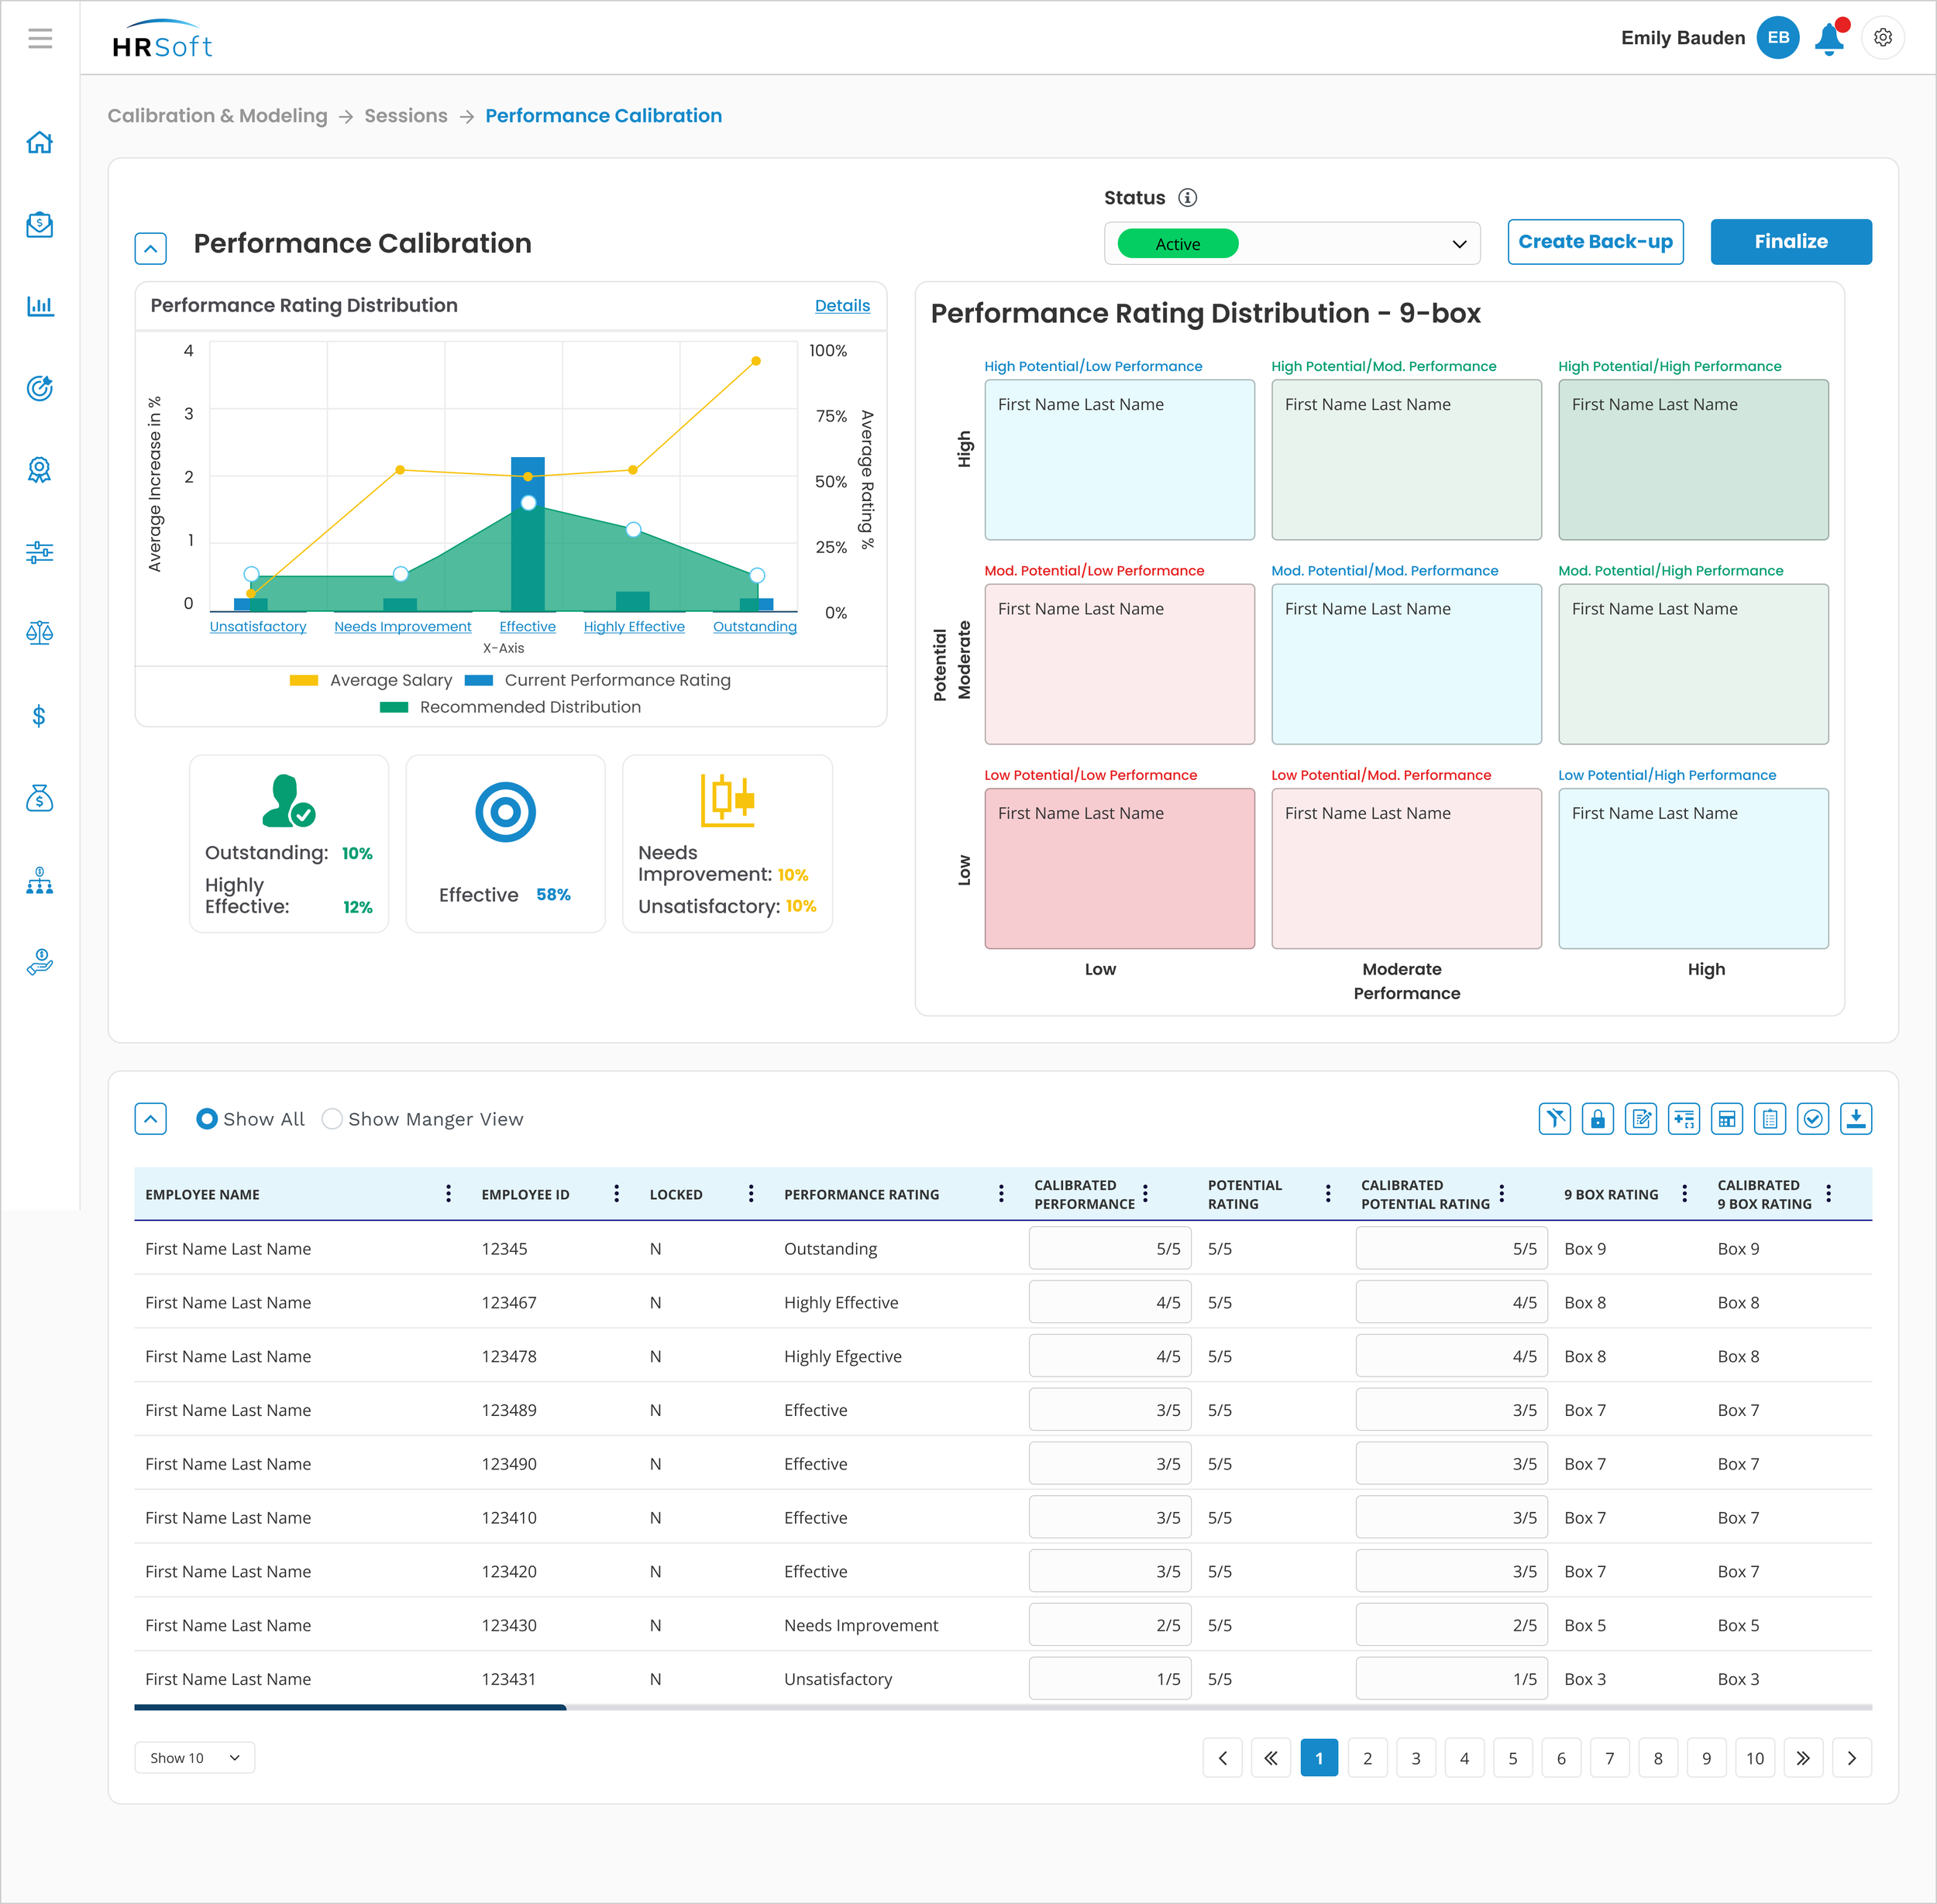
The Performance Calibration screen is designed to help compensation and HR leaders evaluate and adjust performance ratings across teams in a structured, equitable way. The experience enables users to quickly identify patterns, outliers, and inconsistencies while maintaining visibility into individual and group performance distributions. By pairing data with clear visual hierarchy and comparison views, the design supports informed calibration decisions without overwhelming users, helping organizations promote fairness, consistency, and confidence in performance-driven compensation outcomes.
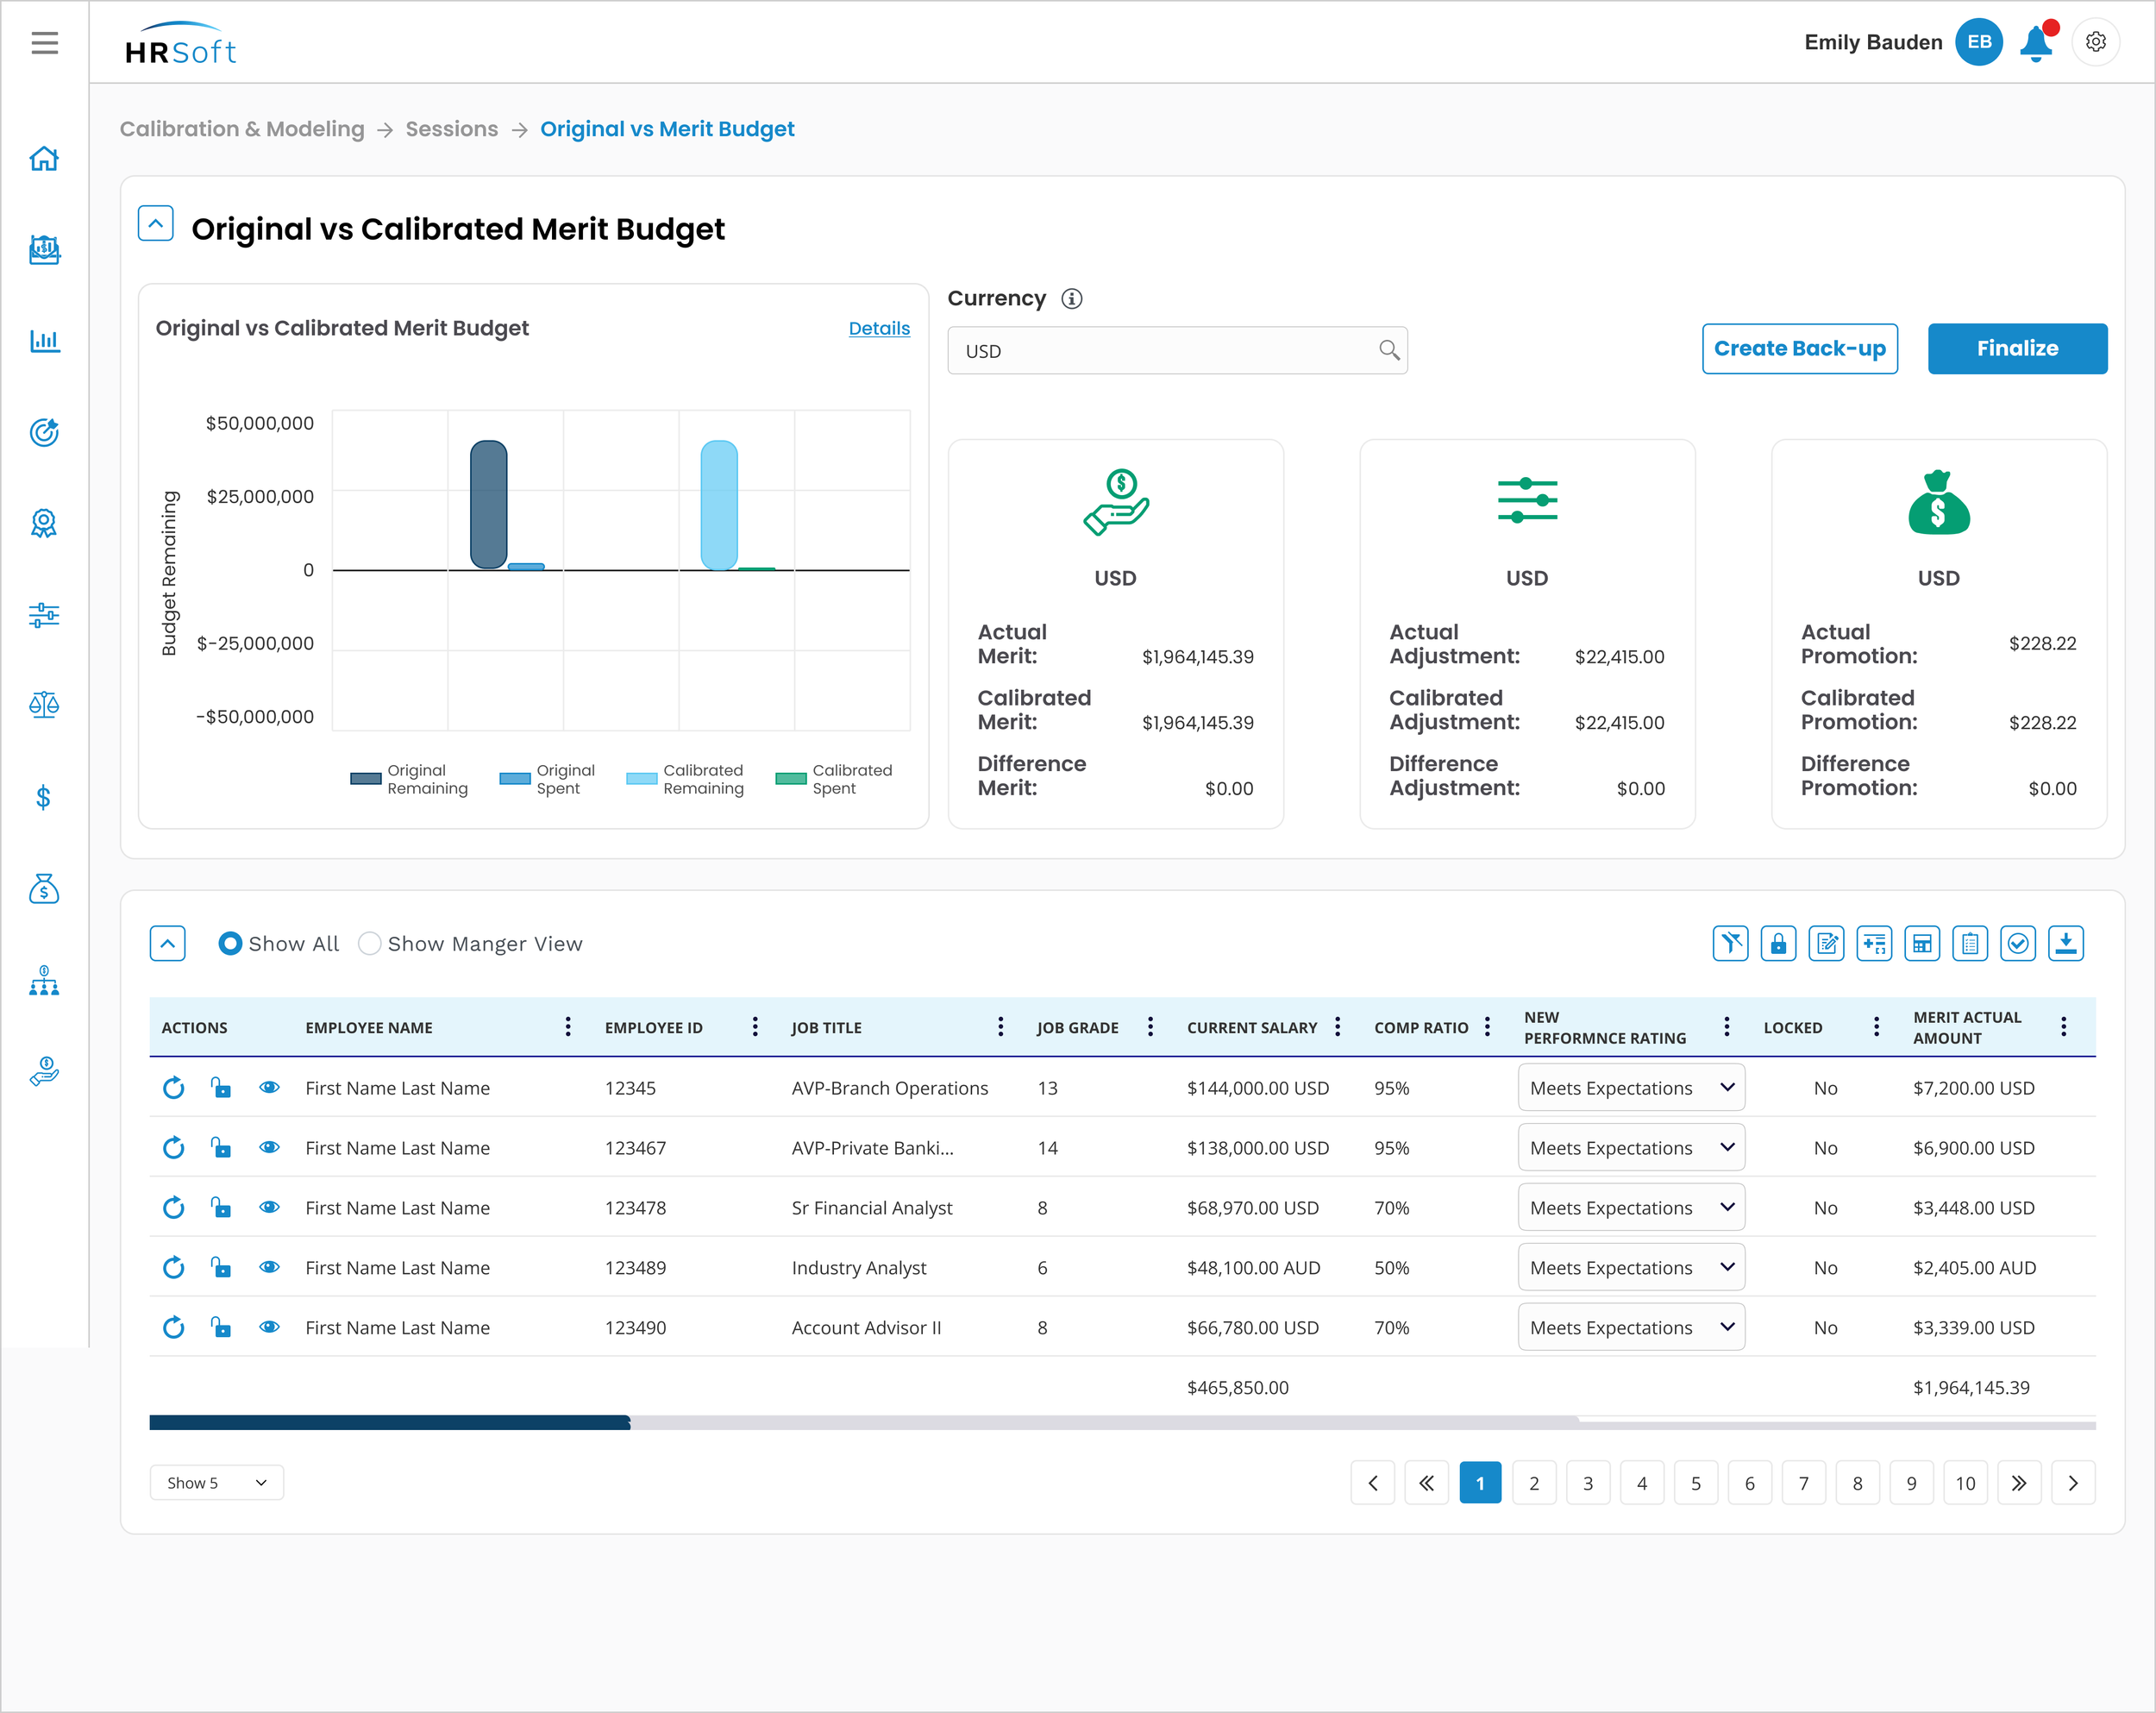
This view allows users to clearly compare initial merit budgets against calibrated outcomes, making the impact of compensation adjustments immediately visible. Rather than requiring manual calculations or spreadsheet exports, the design surfaces trends and budget shifts within a single, focused experience. This side-by-side comparison helps compensation teams understand trade-offs, validate decisions, and confidently align final merit allocations with organizational goals and constraints.
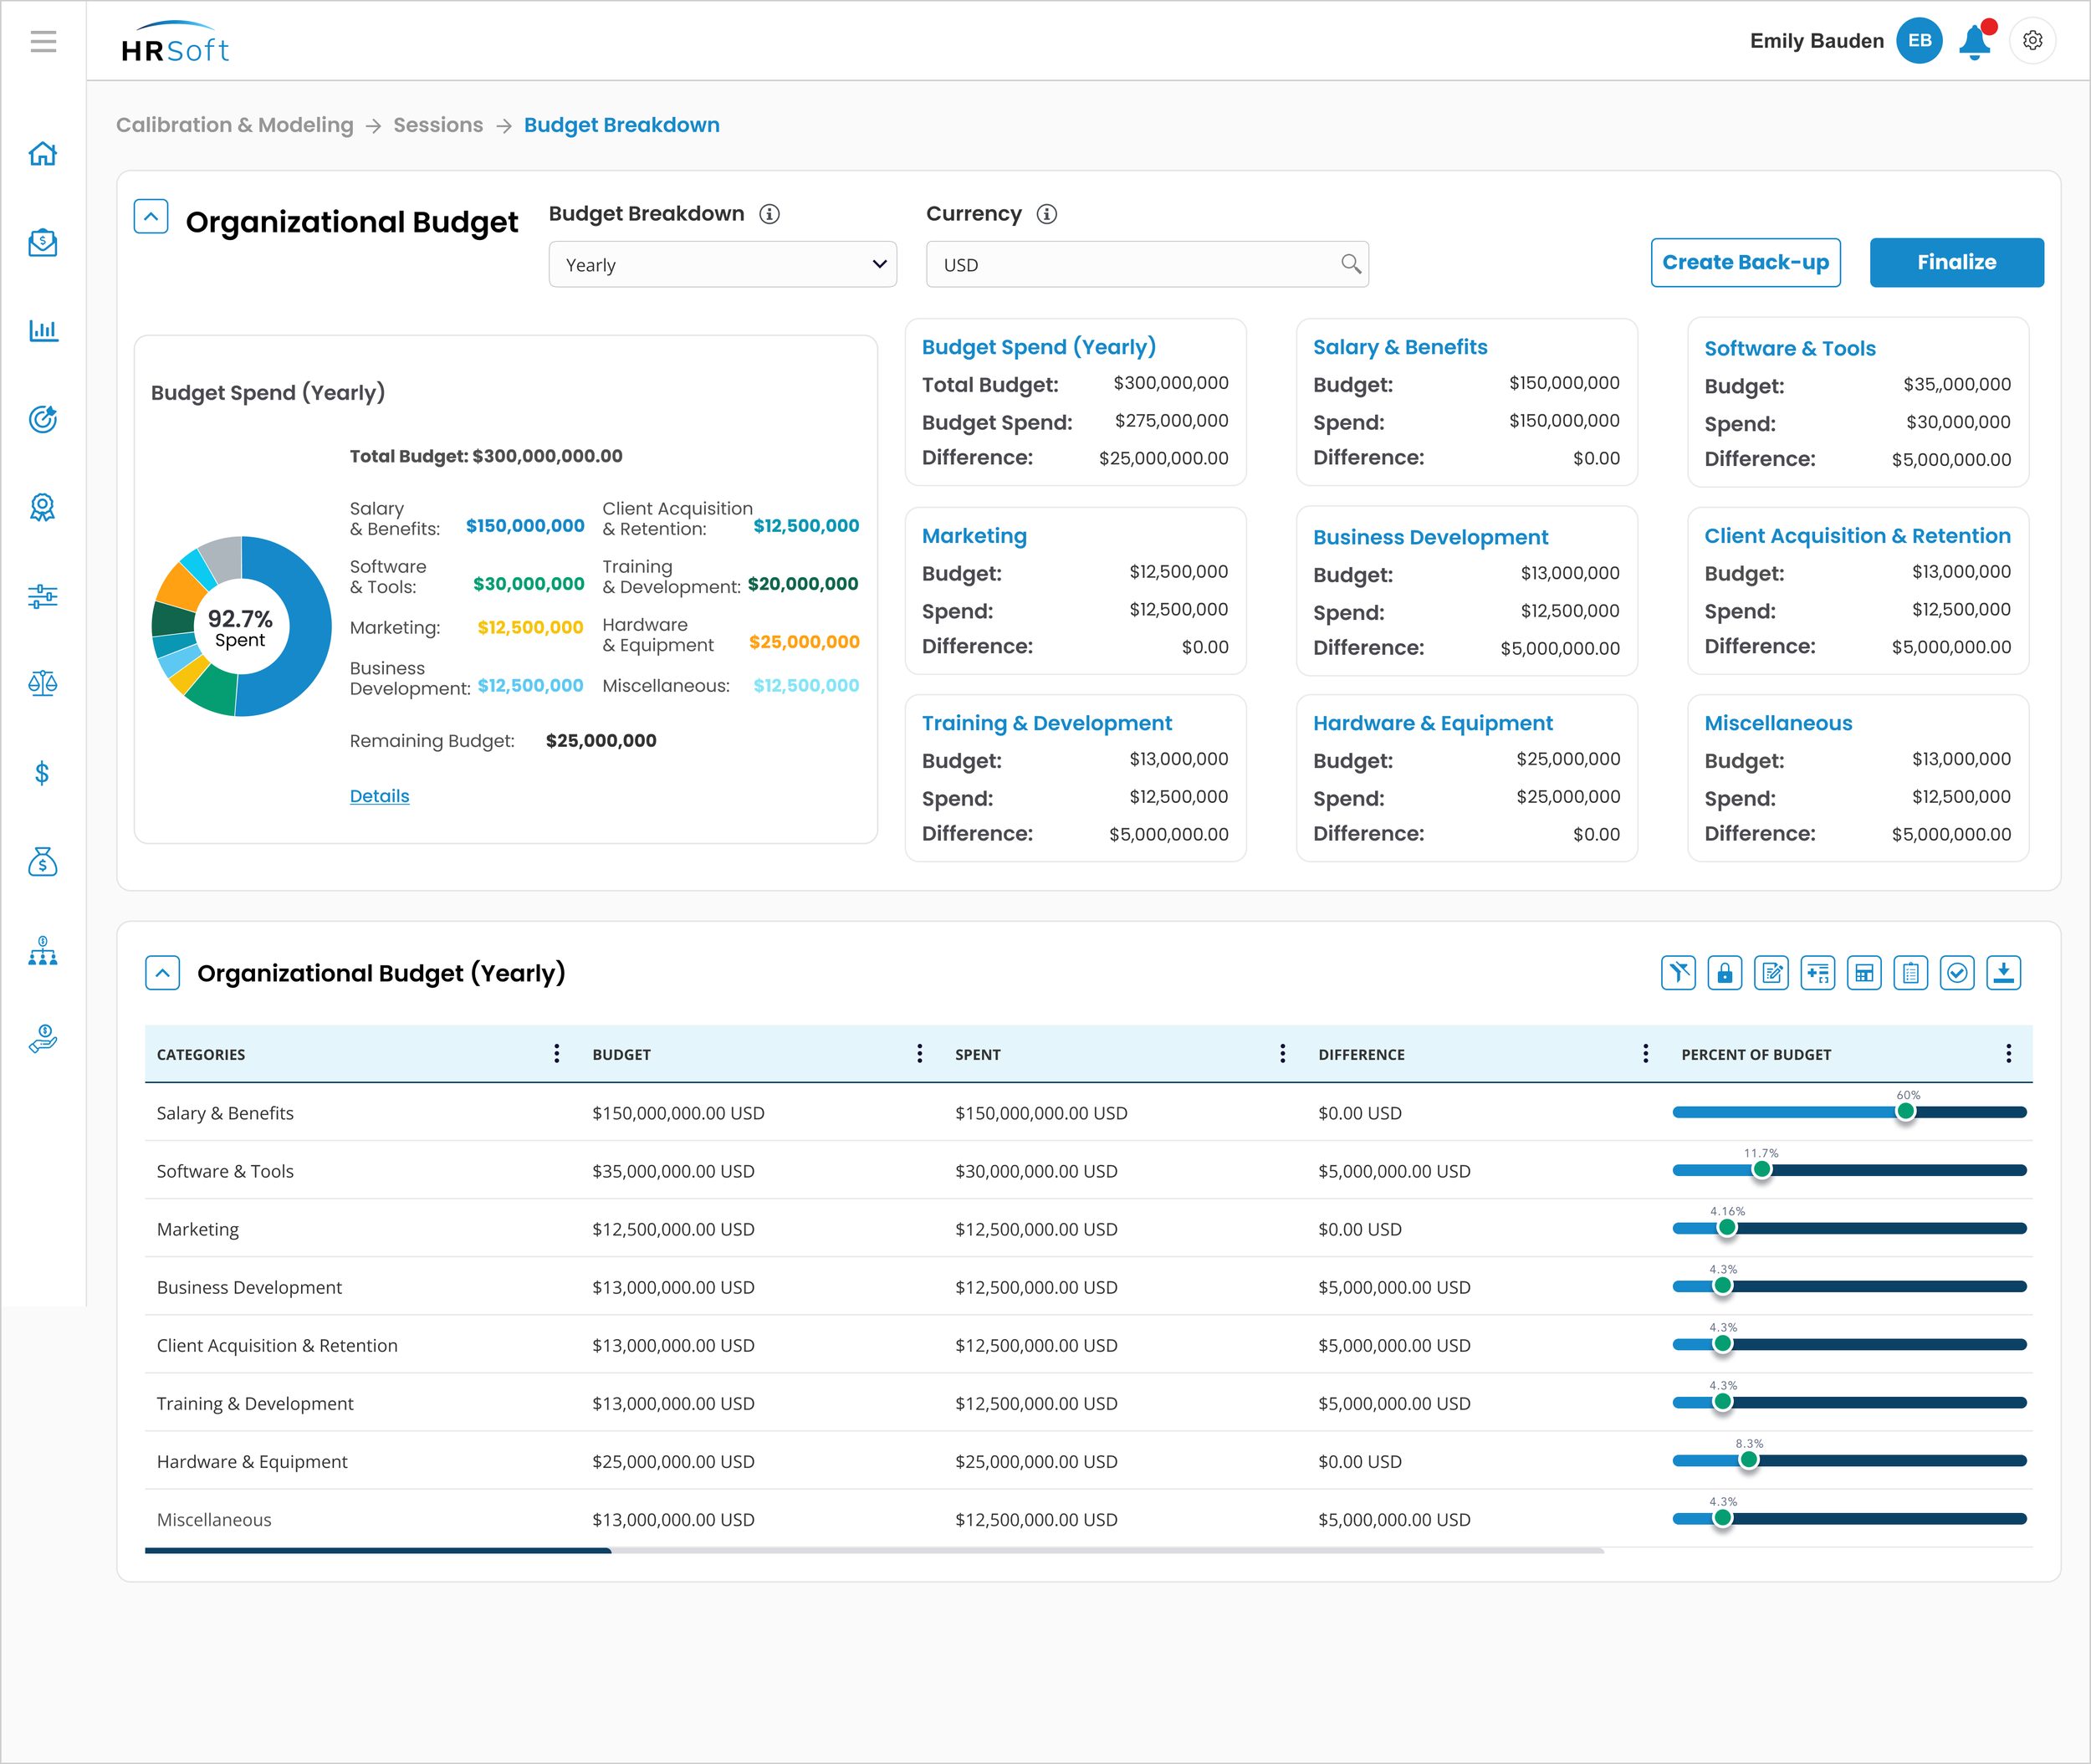
The Organizational Budget screen provides a high-level view of compensation spend across the organization, enabling leaders to assess budget alignment at scale. Information is structured to highlight totals, variances, and remaining allocation in a way that supports strategic planning rather than reactive decision-making. The design balances detail with clarity, allowing users to drill into specific areas when needed while maintaining a strong understanding of overall financial health.
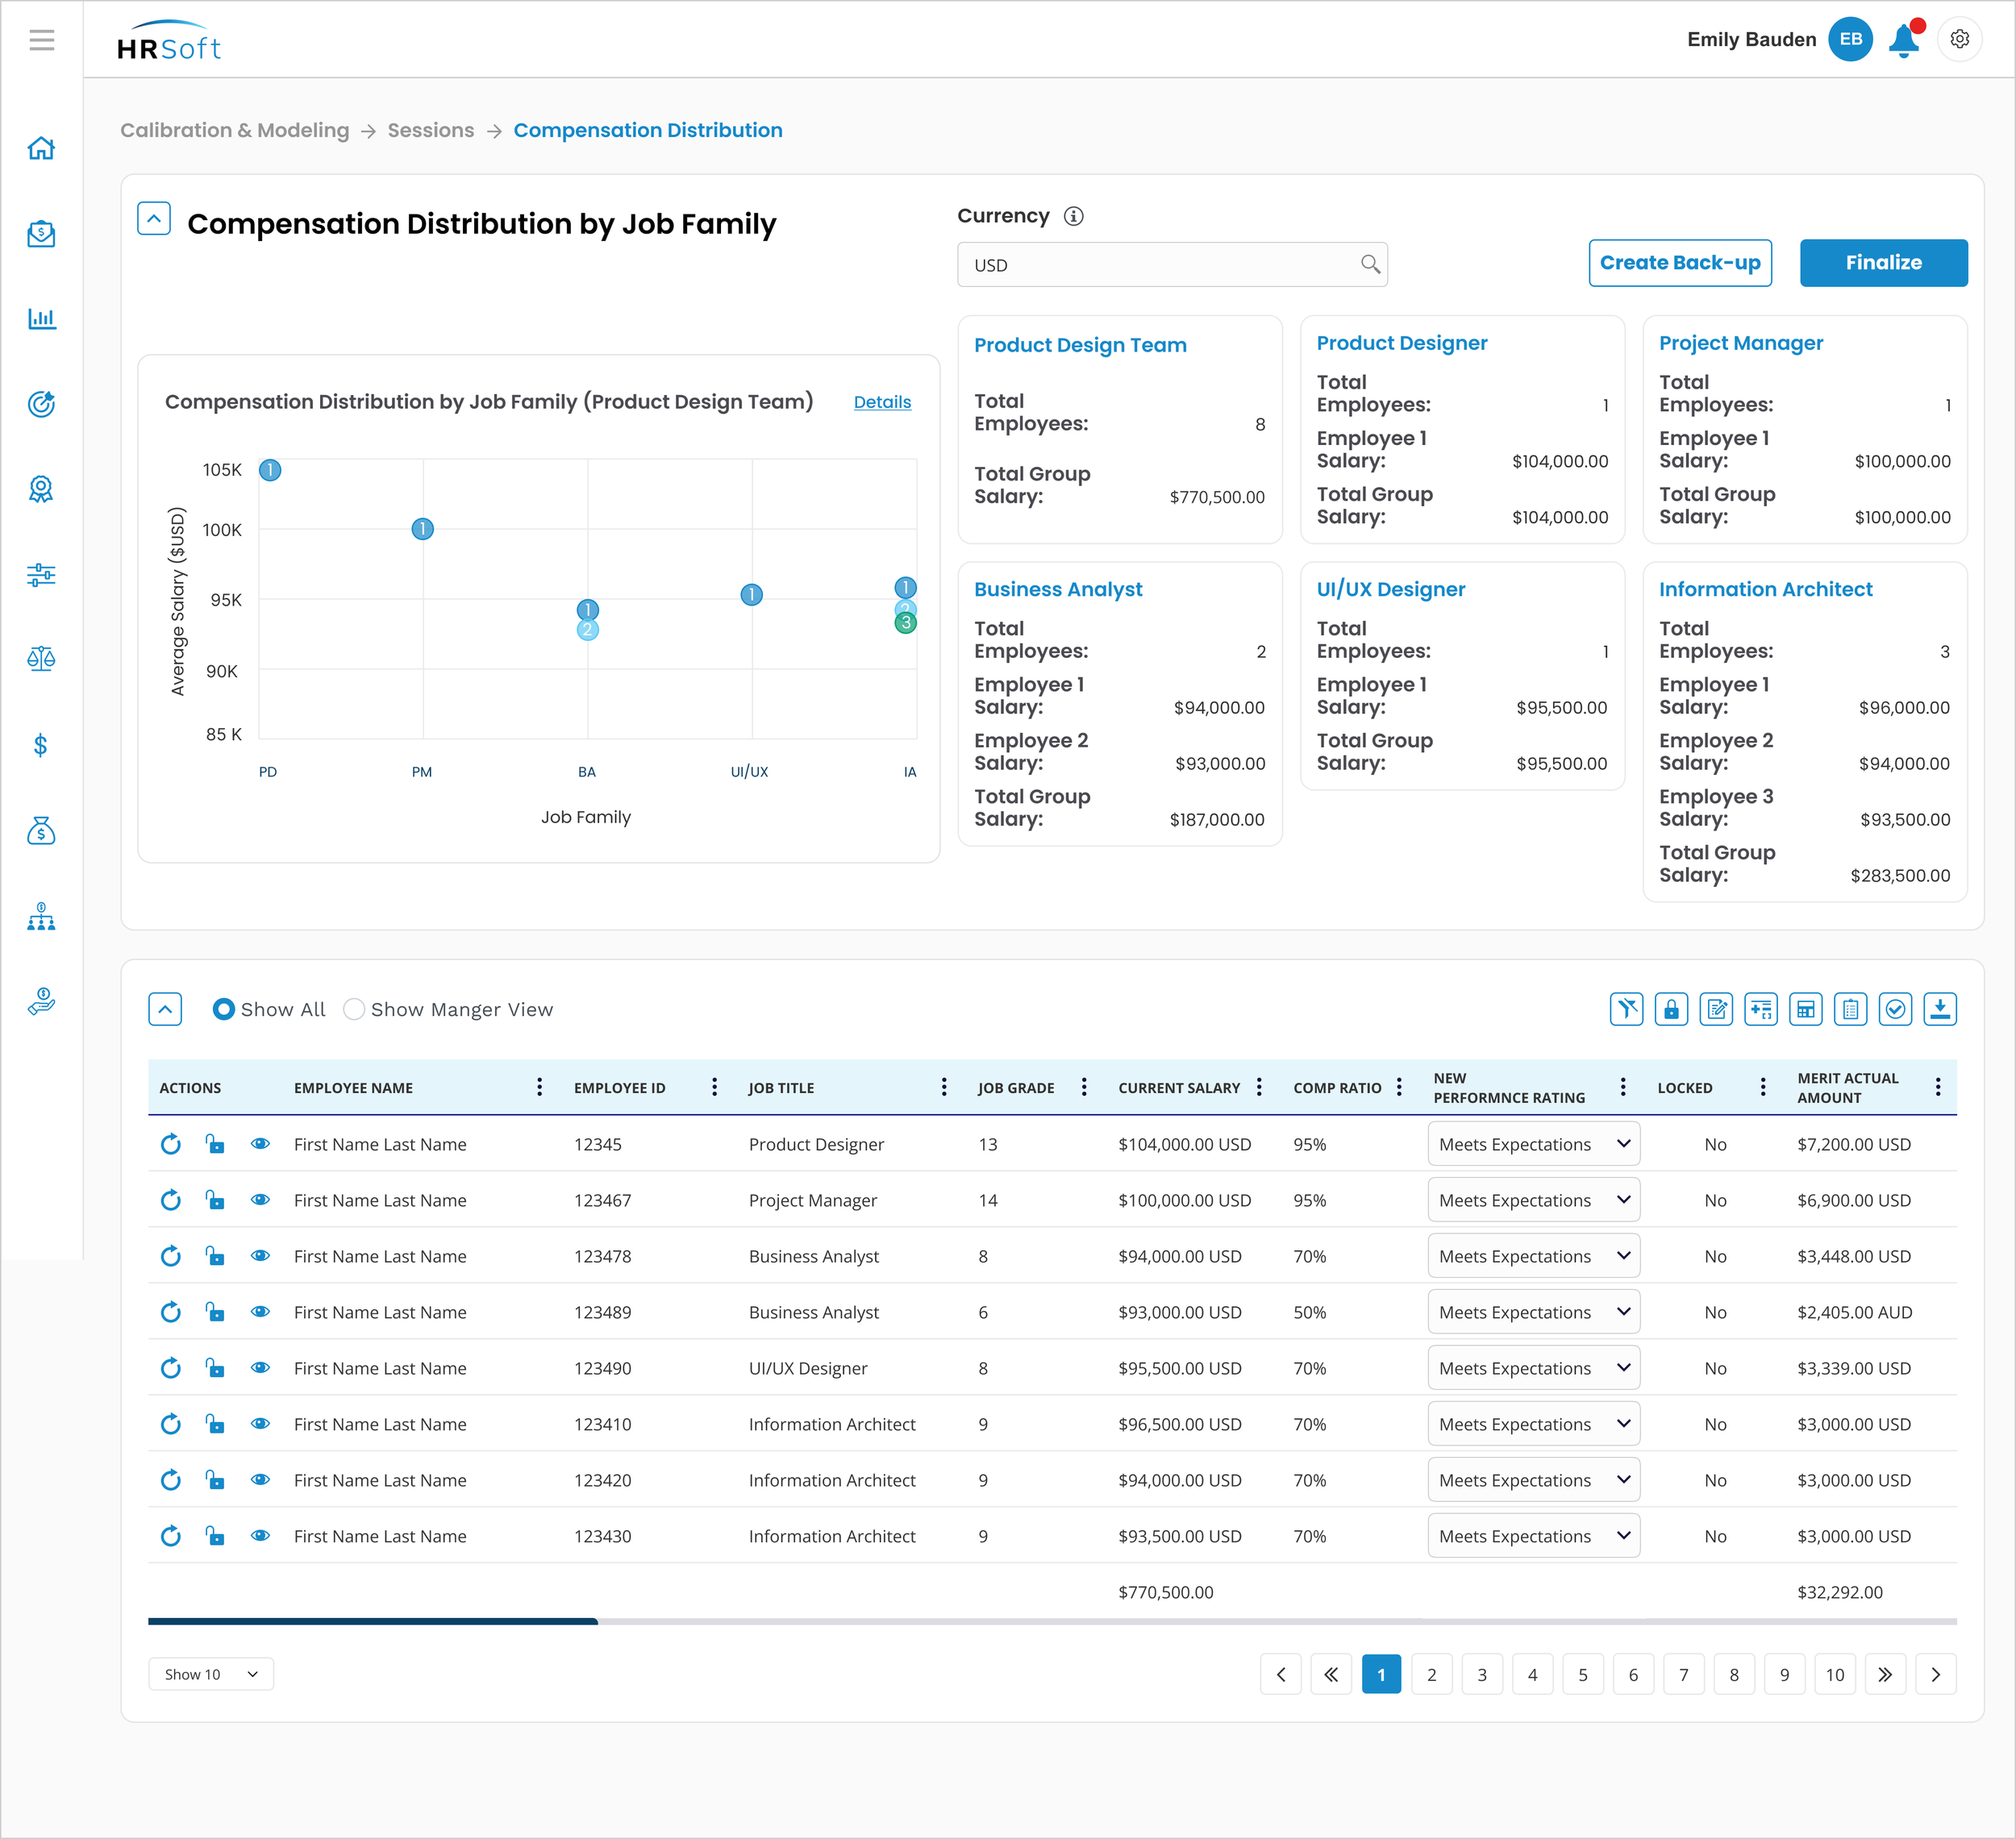
This screen visualizes compensation distribution across job families, helping HR and compensation leaders identify equity gaps, compression risks, and structural inconsistencies. By organizing data into clear, comparable segments, the experience enables users to assess how compensation aligns with role expectations and organizational standards. The design transforms complex distribution data into an actionable view, supporting fair, data-driven compensation strategies across diverse job groups.
HRSoft Award Modeling Software
UI/UX Product Design by Nadia Lee
collaboration with HRSoft PD Team © HRSoft all rights reserved